Skip to store content

Statistics & Integrations

Know What’s Happening

Understand What’s Working.

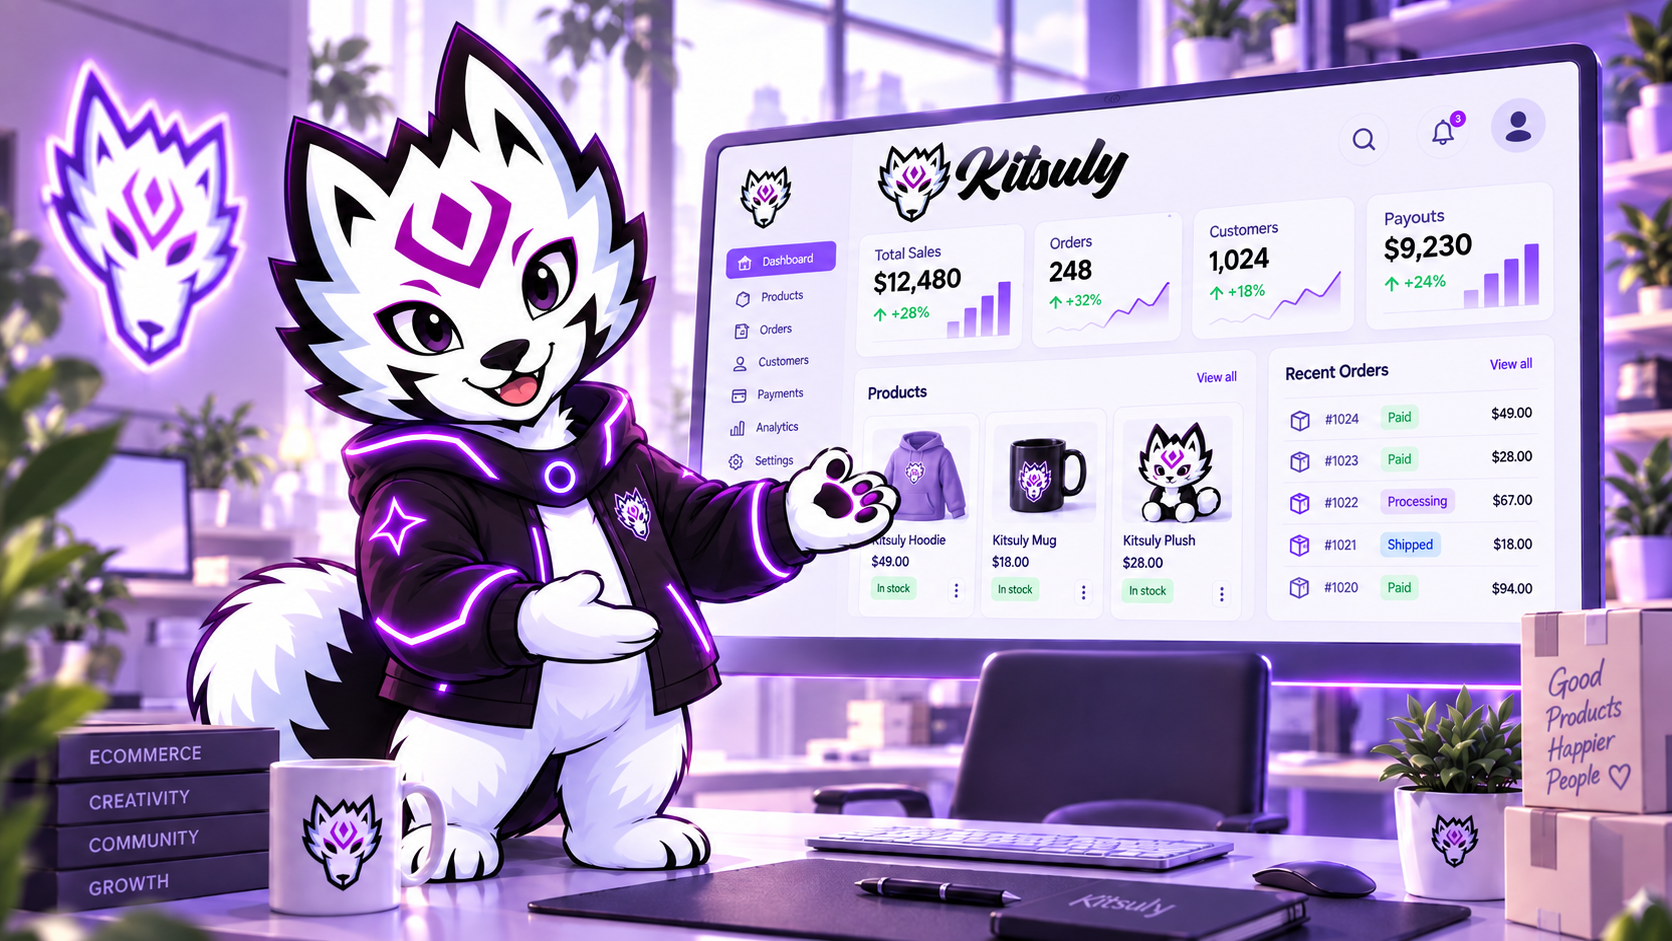
Running an online store shouldn’t mean bouncing between five dashboards just to understand how your business is performing. Kitsuly brings your key store statistics together in one place, combining commerce data, visitor activity, product performance and connected Google insights into a dashboard designed to be actually useful.
Button

Dashboard readouts for every store aspect

See what’s selling, where customers are coming from, how your store is performing over time and where attention might be needed — without leaving WordPress.

Get Kitsuly Now

Your Store, At a Glance

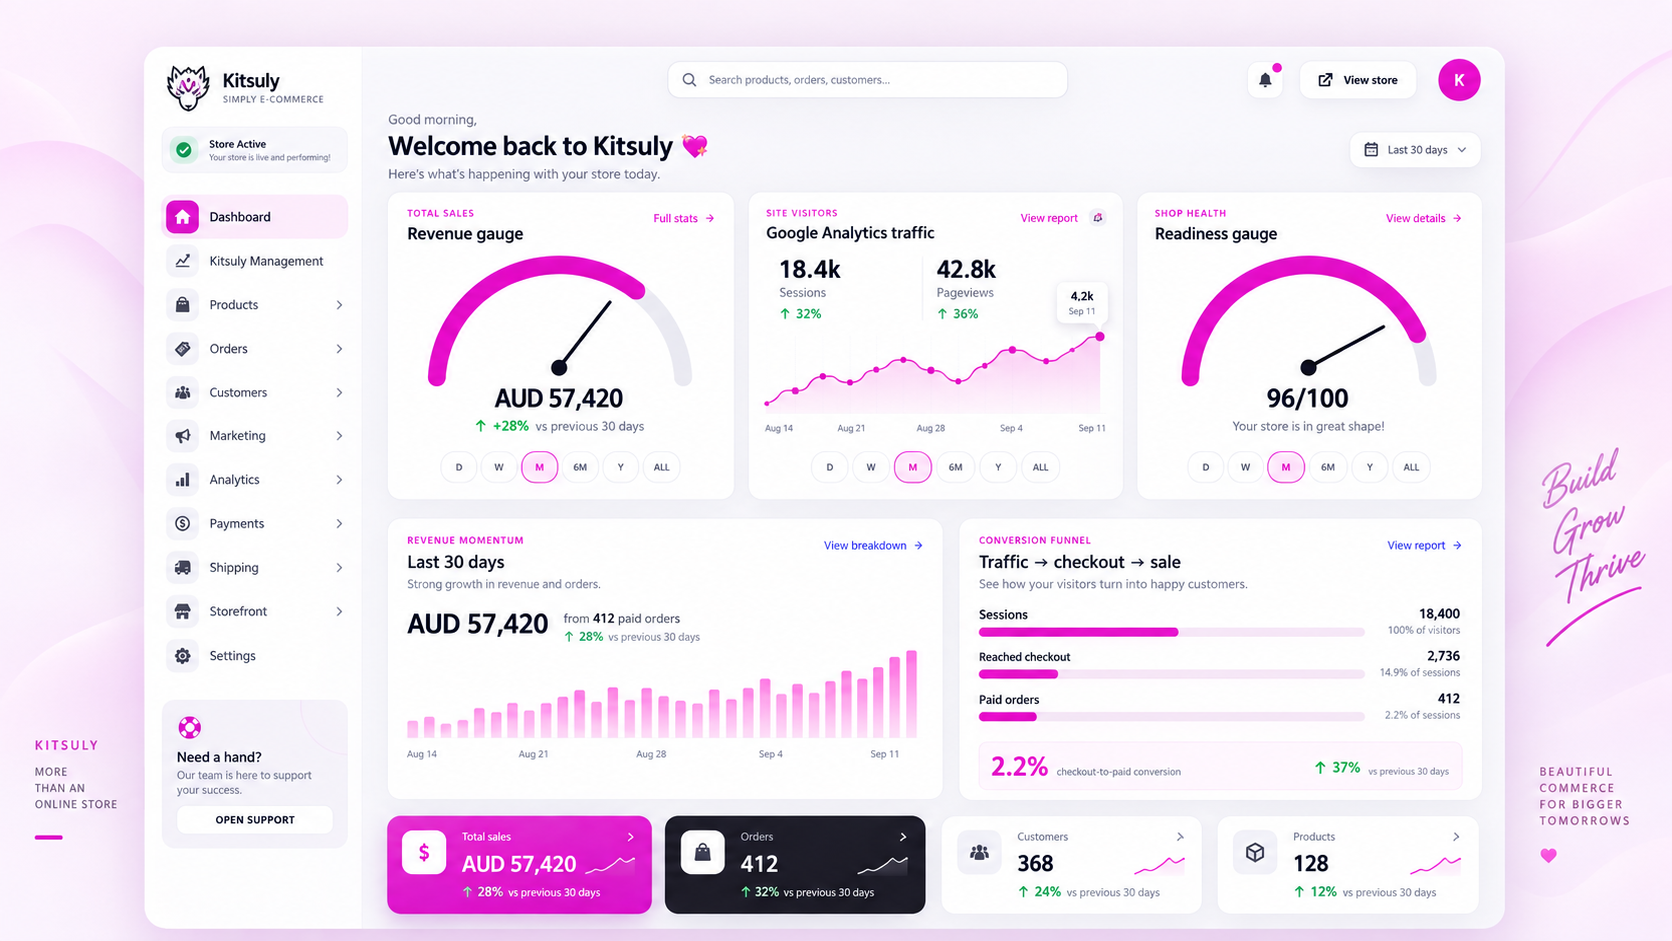
Kitsuly turns day-to-day store activity into easy-to-read visual reporting. Rather than burying information inside spreadsheets and endless tables, the dashboard uses charts, gauges and clear summaries to show you what is happening across your business.

Track sales performance across daily, monthly, six-month, yearly and all-time views, follow visitor trends and quickly understand whether your store is moving in the right direction.
Sales Statistics That Actually Mean Something

Revenue numbers are only useful when you can put them into context.

Kitsuly gives you a clear view of sales across different periods so you can spot growth, slowdowns and changes in customer behaviour. Compare recent performance against longer-term activity, monitor order movement and keep an eye on how your store is performing without digging through individual transactions.

Your dashboard can surface information including total sales, order activity, revenue trends, product performance, customer activity and longer-term store growth.
See More In Documentation

Visual Dashboards, Not Walls of Numbers

Statistics should be easy to understand at a glance.

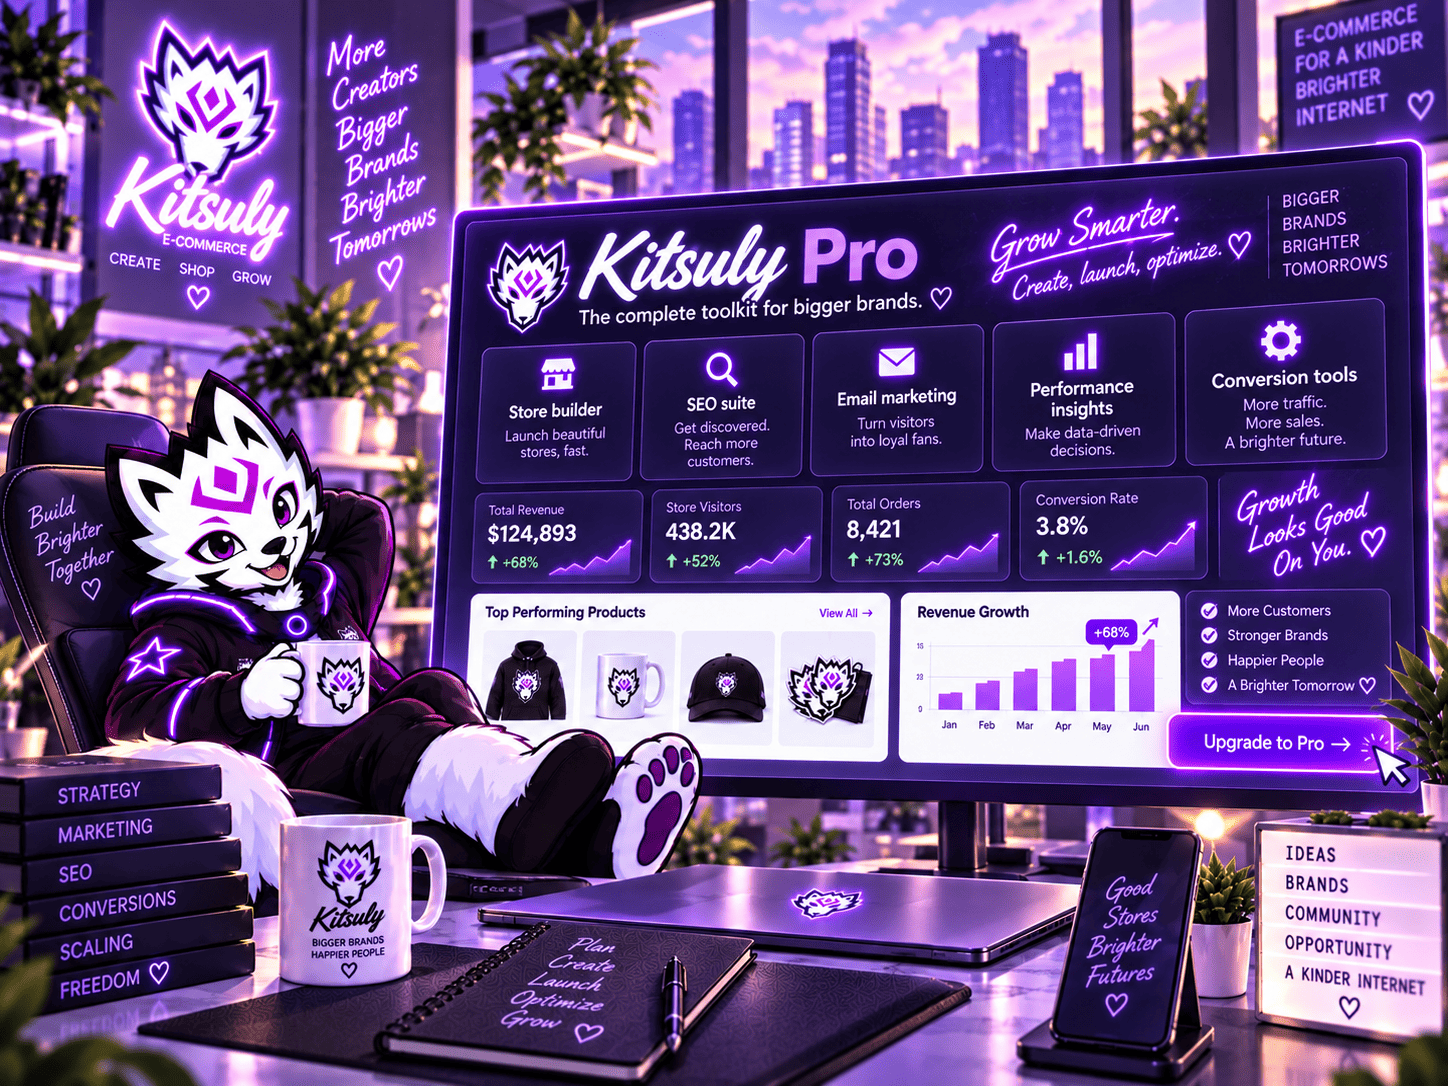
Kitsuly uses gauges, line charts, bar charts and visual status indicators throughout the dashboard so important information stands out immediately. Your main dashboard can bring together multiple performance indicators at once, giving you a quick visual snapshot of sales, visitors, store health and other important metrics.

It’s designed so you can open Kitsuly and understand the state of your store in seconds.

Visitor & Traffic Insights

Knowing how many people are visiting your store is only the beginning.

Kitsuly can display visitor activity over time through visual traffic graphs, helping you see when interest rises, when campaigns are working and when traffic begins to slow.

Combined with your sales information, this gives you a much clearer picture of what visitors are actually doing after they arrive.

More traffic is great. Traffic that converts is better.

Google Search Console Integration

Bring Google Search Data Into Kitsuly

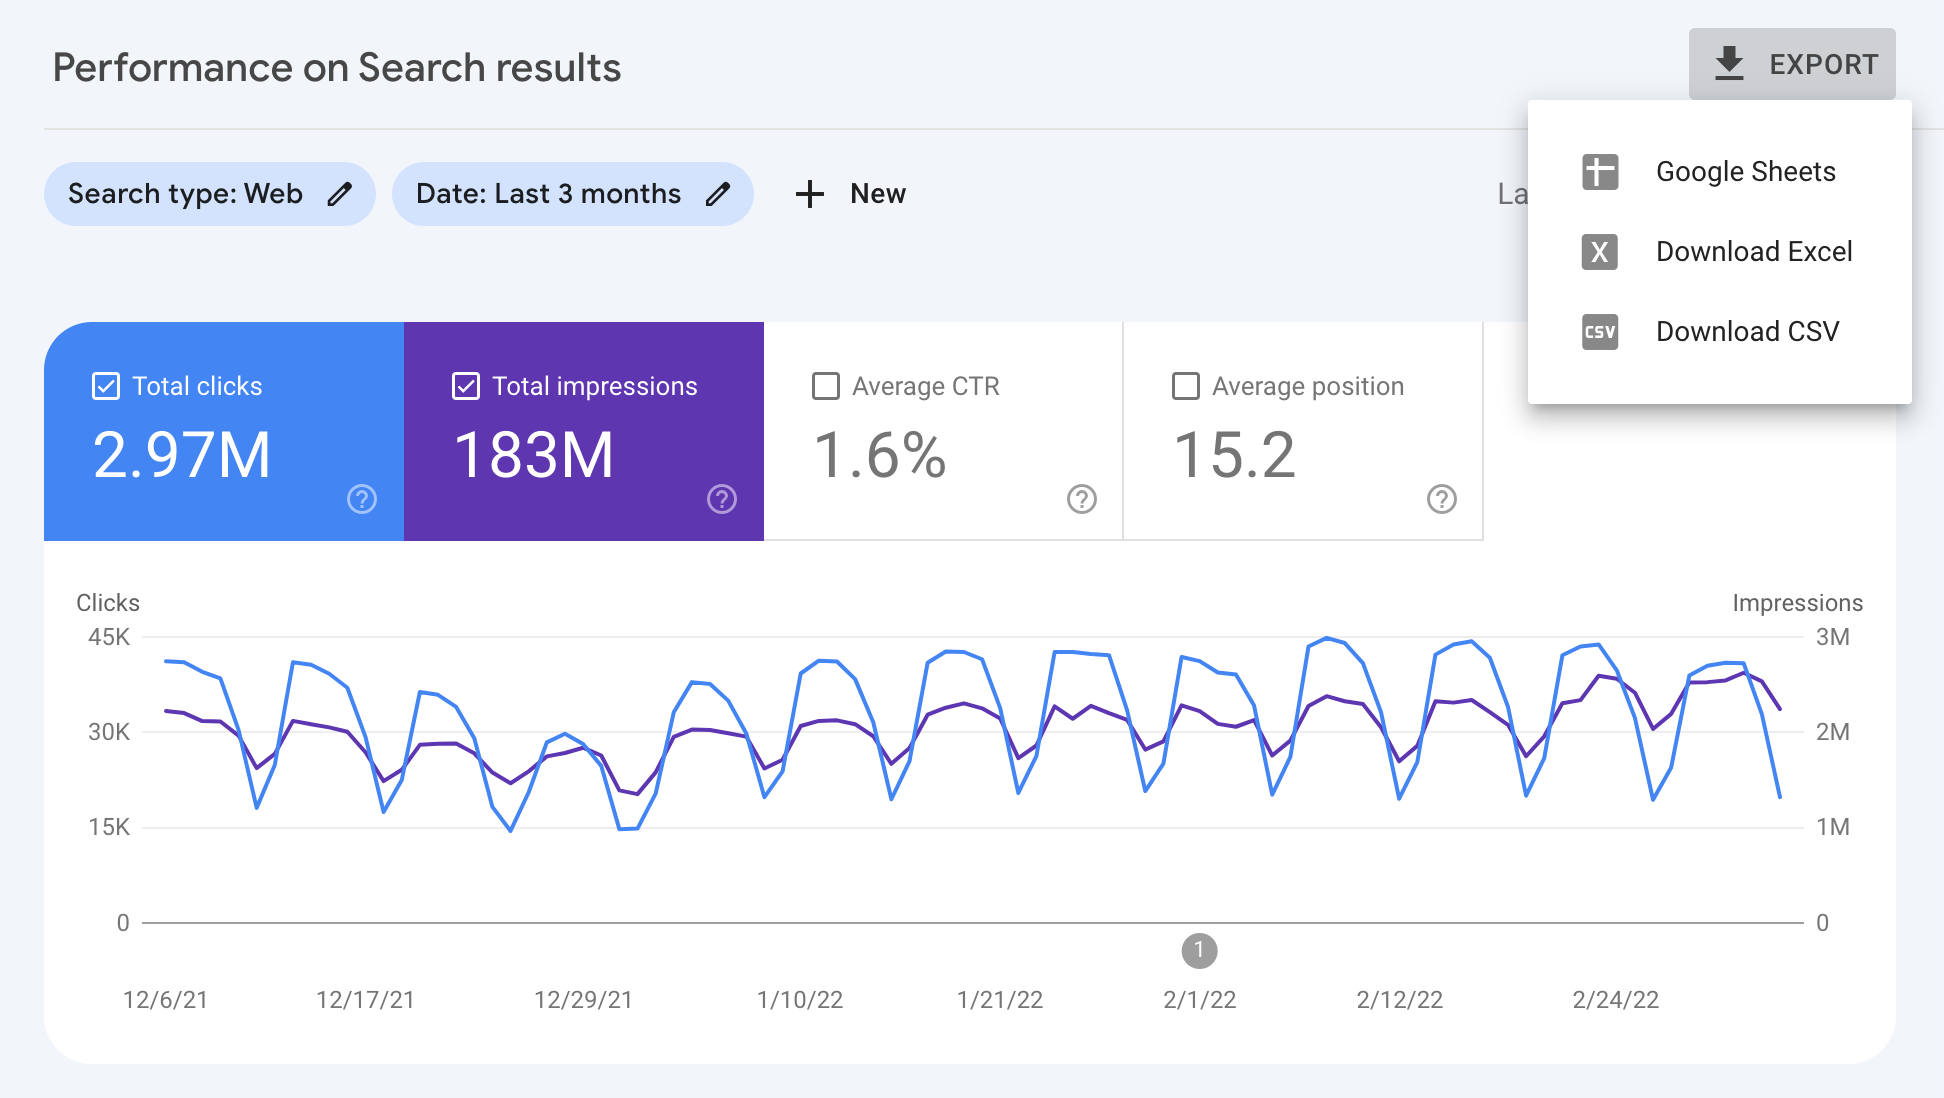
Connect Kitsuly with Google Search Console to bring important search-performance information closer to the rest of your store data.

Search Console helps you understand how your website appears in Google Search — including the searches people use to find you, how often your pages appear, how frequently people click through and how your visibility changes over time.

Instead of treating SEO and ecommerce as completely separate parts of your business, Kitsuly helps bring them together.

Statistics & Integrations

Know What’s Happening

Understand What’s Working.

Running an online store shouldn’t mean bouncing between five dashboards just to understand how your business is performing. Kitsuly brings your key store statistics together in one place, combining commerce data, visitor activity, product performance and connected Google insights into a dashboard designed to be actually useful.

Button

Dashboard readouts for every store aspect

See what’s selling, where customers are coming from, how your store is performing over time and where attention might be needed — without leaving WordPress.

Get Kitsuly Now

Your Store, At a Glance

Kitsuly turns day-to-day store activity into easy-to-read visual reporting. Rather than burying information inside spreadsheets and endless tables, the dashboard uses charts, gauges and clear summaries to show you what is happening across your business.

Track sales performance across daily, monthly, six-month, yearly and all-time views, follow visitor trends and quickly understand whether your store is moving in the right direction.

Sales Statistics That Actually Mean Something

Revenue numbers are only useful when you can put them into context.

Kitsuly gives you a clear view of sales across different periods so you can spot growth, slowdowns and changes in customer behaviour. Compare recent performance against longer-term activity, monitor order movement and keep an eye on how your store is performing without digging through individual transactions.

Your dashboard can surface information including total sales, order activity, revenue trends, product performance, customer activity and longer-term store growth.

See More In Documentation

Visual Dashboards, Not Walls of Numbers

Statistics should be easy to understand at a glance.

Kitsuly uses gauges, line charts, bar charts and visual status indicators throughout the dashboard so important information stands out immediately. Your main dashboard can bring together multiple performance indicators at once, giving you a quick visual snapshot of sales, visitors, store health and other important metrics.

It’s designed so you can open Kitsuly and understand the state of your store in seconds.

Visitor & Traffic Insights

Knowing how many people are visiting your store is only the beginning.

Kitsuly can display visitor activity over time through visual traffic graphs, helping you see when interest rises, when campaigns are working and when traffic begins to slow.

Combined with your sales information, this gives you a much clearer picture of what visitors are actually doing after they arrive.

More traffic is great. Traffic that converts is better.

Google Search Console Integration

Bring Google Search Data Into Kitsuly

Connect Kitsuly with Google Search Console to bring important search-performance information closer to the rest of your store data.

Search Console helps you understand how your website appears in Google Search — including the searches people use to find you, how often your pages appear, how frequently people click through and how your visibility changes over time.

Instead of treating SEO and ecommerce as completely separate parts of your business, Kitsuly helps bring them together.